At a Glance
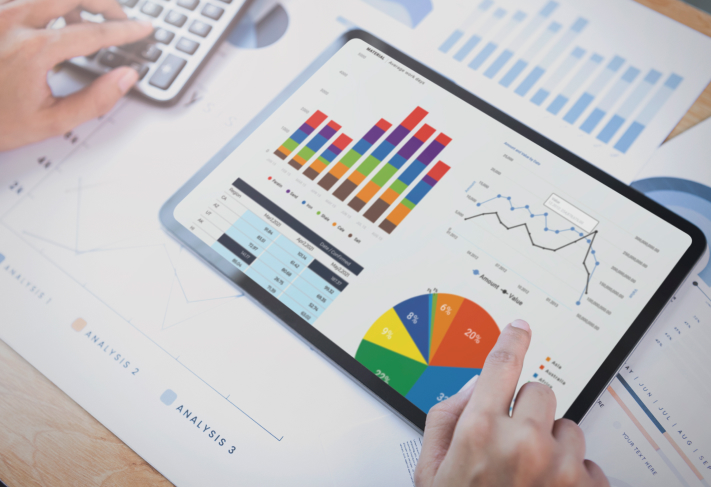
The client wanted to develop analytical dashboards from multiple data sources, with primary data sources like SAP and secondary sources like Microsoft SQL Server having data from different applications and departments.
-
Database Design
0+
Dashboards
-
Users
0+
Records
-
Tableau Dashboard and Report creation
0+
Users
Challenges
- Data Volume and Velocity: Summarizing and visualizing millions of primary sales records and trillions of secondary sales records in near real-time.
Data Integration: Integrating data from diverse sources, ensuring consistency and accuracy. - Data Quality: Ensuring high data quality and addressing issues like duplicates, missing values, and inaccuracies.
- Performance Optimization: Ensuring fast and responsive dashboard performance despite large data volumes.
- Scalability: Building a scalable solution that can grow with increasing data volumes and complexity.
- User Accessibility: Making data accessible and understandable to users with varying levels of technical expertise.
- Real Time Monitoring: Need for real-time monitoring of production metrics, identifying bottlenecks, and ensuring optimal resource utilization.
- Inventory Management: Managing distributor performance, tracking inventory levels, and analyzing distribution efficiency.
- Sales Performance Tracking: Monitoring sales performance, analyzing trends, and forecasting future sales to inform strategy.
Objectives
- Enhanced Data Visibility: Transform tabular reports, containing millions of primary sales and trillions of secondary sales records, into interactive visual dashboards.
- Role-Based Access Control: Implement secure, role-based access to dashboards to ensure sensitive data is only available to authorized personnel.
- Department-Specific Dashboards: Create detailed dashboards for departments such as production, distributor details, and sales.
- Efficient Data Handling: Transfer data from SAP to SQL Server and aggregate it for efficient processing.
- Advanced Analytics: Develop over 100+ dashboards with complex calculations and customized filters.
- Centralized Dashboard Access: Design a landing page for easy navigation of accessible dashboards.
- Tableau Administration: Manage the Tableau environment, including installation, upgrades, and administrative tasks.
How we helped?
The Tableau dashboards and reports are created using Microsoft SQL Server Summarized tables with incremental data load. Data is loaded from SAP to SQL Server using Talend as an ETL tool.
The Solution
Data Extraction and Transformation
ETL Process: Talend was used to extract data from SAP and transform it. Aggregation and summarization of data were performed to optimize for dashboard performance. SQL Server Storage: Transformed data was stored in SQL Server summarized tables, ensuring high performance and quick access.
Dashboard Development
Custom Dashboards: Over 100 dashboards were developed using Tableau, each tailored to specific departmental needs
Technology We have used
Start your journey towards successful software design and development with complete data security measures.

We had love to hear from you
Let’s Connect for a Successful Digital Transformation Journey.

Fill Out the form and we’ll be in touch
Coding Innovation, Delivering Impact.
We craft cutting-edge software solutions that drive innovation and create meaningful impact. Our expertise transforms ideas into powerful digital experiences.


