Panth Softech Team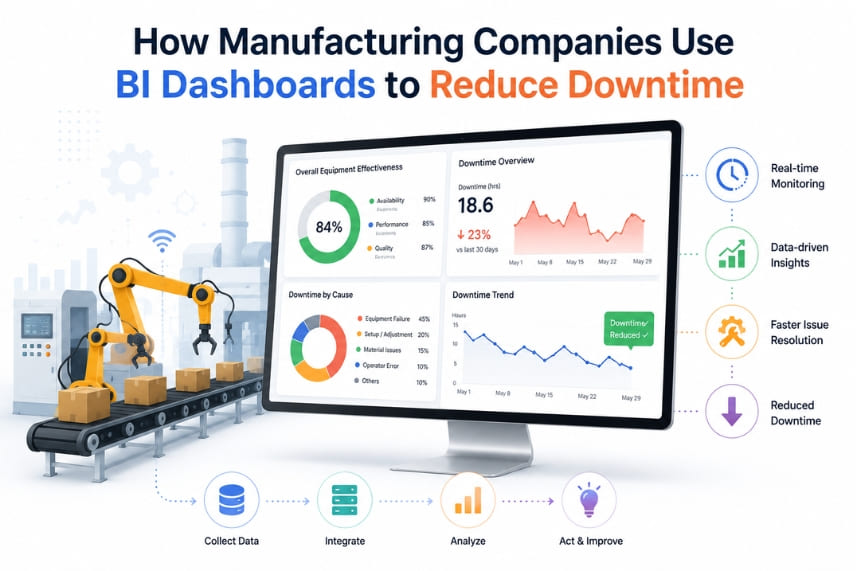
Manufacturing companies generate enormous amounts of operational data every day—from production lines and machines to inventory systems and quality inspections. Yet many organizations still rely on spreadsheets, disconnected reports, or delayed manual updates to monitor factory performance. This lack of real-time visibility often leads to unexpected equipment failures, production bottlenecks, and costly downtime.
According to industry research, even a few minutes of unplanned downtime can result in significant production losses, delayed deliveries, increased maintenance expenses, and reduced customer satisfaction. As manufacturing becomes increasingly digital, businesses need faster and more accurate ways to monitor operations and make informed decisions.
This is where BI Dashboards for Manufacturing play a transformative role. By consolidating data from production equipment, ERP systems, Manufacturing Execution Systems (MES), IoT sensors, and quality management platforms, Business Intelligence (BI) dashboards provide a centralized, real-time view of manufacturing operations. Instead of reacting to issues after they occur, production teams can identify performance trends, detect anomalies, and take proactive action before small problems become major disruptions.
In this guide, you’ll learn how BI Dashboards for Manufacturing help companies minimize downtime, monitor key production KPIs, improve operational efficiency, and build smarter, data-driven manufacturing processes. We’ll also explore the essential dashboard features, implementation best practices, and the future of Business Intelligence in smart manufacturing.
Key Takeaways
Before diving deeper, here are the key insights you’ll gain from this guide:
- Understand what BI Dashboards for Manufacturing are and why they have become essential for modern production facilities.
- Learn the most common causes of manufacturing downtime and how real-time analytics help prevent them.
- Discover how manufacturing companies use Business Intelligence dashboards to monitor equipment performance, production efficiency, and operational KPIs.
- Explore the most important manufacturing metrics, including OEE, machine utilization, MTBF, MTTR, production throughput, and quality indicators.
- Identify the features every modern Manufacturing Analytics Dashboard should include for real-time monitoring and reporting.
- Learn best practices for implementing manufacturing dashboard software across production environments.
- See how AI, Industrial IoT (IIoT), and predictive analytics are shaping the future of manufacturing Business Intelligence.
What Are BI Dashboards for Manufacturing?
BI Dashboards for Manufacturing are interactive reporting and visualization tools that collect, organize, and display manufacturing data from multiple business systems in a single, easy-to-understand interface. These dashboards transform complex production data into actionable insights, enabling manufacturers to monitor operations in real time and make faster, data-driven decisions.
Unlike traditional reports that provide historical information after production is complete, Manufacturing BI Dashboards continuously update with live data from machines, sensors, ERP systems, Manufacturing Execution Systems (MES), SCADA platforms, and Industrial IoT devices. This real-time visibility allows production managers to quickly identify inefficiencies, monitor equipment health, and respond to operational issues before they impact productivity.
A well-designed Manufacturing Performance Dashboard doesn’t simply display charts and graphs—it provides meaningful insights into factory performance by tracking key operational metrics across every stage of the production process. Whether monitoring a single production line or multiple manufacturing facilities, BI dashboards provide a centralized view of critical business information that supports informed decision-making.
Common Data Sources for Manufacturing BI Dashboards
Manufacturing dashboards typically integrate data from various operational and enterprise systems, including:
- Enterprise Resource Planning (ERP) systems
- Manufacturing Execution Systems (MES)
- SCADA and PLC systems
- Industrial IoT (IIoT) devices and sensors
- Warehouse Management Systems (WMS)
- Quality Management Systems (QMS)
- Maintenance Management Systems (CMMS)
- Production planning software
- Supply chain and inventory management platforms
By consolidating information from these systems, manufacturers eliminate data silos and gain a unified view of operations across the entire production lifecycle.
What Can Manufacturing BI Dashboards Monitor?
Modern Manufacturing Dashboard Software helps organizations monitor virtually every aspect of factory operations, including:
- Machine availability and utilization
- Overall Equipment Effectiveness (OEE)
- Production throughput
- Equipment downtime
- Production cycle time
- Inventory levels
- Maintenance schedules
- Quality metrics and defect rates
- Scrap and rework percentages
- Energy consumption
- Labor productivity
- Production targets versus actual performance
Instead of reviewing multiple reports from different departments, decision-makers can access all critical KPIs through a single interactive dashboard.
Why Manufacturing Downtime Happens
Manufacturing downtime is one of the biggest challenges facing production facilities today. Whether planned or unplanned, downtime directly impacts productivity, operational efficiency, delivery schedules, and profitability. While scheduled maintenance is necessary to ensure equipment reliability, unexpected downtime often results in significant financial losses and operational disruptions.
Many manufacturing companies struggle to identify the root causes of downtime because operational data is scattered across multiple systems. Without real-time monitoring and centralized reporting, small performance issues often go unnoticed until they lead to equipment failures or production stoppages.
Below are some of the most common reasons manufacturing downtime occurs.
Equipment Failures
Unexpected machine breakdowns remain one of the leading causes of production interruptions. Aging equipment, worn components, and delayed maintenance can quickly bring production lines to a halt.
Lack of Real-Time Visibility
When production managers rely on delayed reports or manual data collection, they often discover operational issues long after they have affected production performance. Limited visibility prevents teams from responding proactively.
Poor Preventive Maintenance
Many organizations still follow fixed maintenance schedules instead of condition-based or predictive maintenance strategies. This approach increases the likelihood of unexpected equipment failures and unnecessary maintenance costs.
Production Bottlenecks
Inefficient workflows, machine capacity constraints, and imbalanced production processes create bottlenecks that reduce overall throughput and increase idle time across manufacturing operations.
Inventory and Material Shortages
Insufficient raw materials or delayed inventory replenishment can stop production unexpectedly. Without integrated inventory monitoring, manufacturers often struggle to anticipate supply chain disruptions.
Quality Issues and Rework
Defective products, failed inspections, and excessive scrap require production lines to stop for troubleshooting, corrections, or additional quality checks, reducing overall manufacturing efficiency.
Human Errors
Manual processes, inconsistent operating procedures, and communication gaps can lead to production delays, incorrect machine configurations, and operational inefficiencies.
Disconnected Business Systems
When ERP, MES, maintenance systems, and production equipment operate independently, organizations lack a unified view of manufacturing operations. This fragmented data environment makes it difficult to identify trends, predict failures, and optimize production performance.
Fortunately, modern Business Intelligence for Manufacturing addresses these challenges by providing centralized, real-time visibility into manufacturing operations. In the next section, we’ll explore how BI Dashboards for Manufacturing help organizations proactively identify issues, reduce downtime, and improve production efficiency before problems escalate.
How BI Dashboards Help Reduce Manufacturing Downtime
Manufacturing downtime rarely happens without warning. Machines often exhibit early signs of declining performance, production bottlenecks begin to form, or quality metrics gradually deteriorate before a complete failure occurs. The challenge for many manufacturers is identifying these warning signals early enough to take corrective action.
This is where BI Dashboards for Manufacturing make a significant difference. By consolidating data from ERP systems, Manufacturing Execution Systems (MES), Industrial IoT (IIoT) devices, SCADA systems, and maintenance platforms, manufacturers gain real-time visibility into every stage of production. Instead of reacting after equipment fails or production stops, decision-makers can proactively monitor operations, identify anomalies, and prevent costly downtime.
Below are some of the most impactful ways Manufacturing BI Dashboards help reduce downtime and improve factory performance.
Real-Time Production Monitoring
Production managers need immediate visibility into factory operations to quickly identify issues before they impact output. A Manufacturing Operations Dashboard provides live insights into production lines, equipment status, work orders, and operational performance from a centralized interface.
Instead of waiting for end-of-shift reports, supervisors can monitor production in real time and immediately respond to delays, machine stoppages, or abnormal performance.
Benefits:
- Monitor production lines in real time
- Detect operational disruptions instantly
- Improve production visibility
- Respond to issues faster
- Reduce production delays
Machine Performance Tracking
Monitoring machine health is essential for maintaining production continuity. Manufacturing Performance Dashboards continuously track equipment utilization, runtime, idle time, and performance trends, helping maintenance teams identify underperforming assets before failures occur.
Historical performance data also helps organizations understand recurring equipment issues and prioritize maintenance activities based on actual machine behavior.
Benefits:
- Improve equipment utilization
- Identify underperforming assets
- Reduce unexpected machine failures
- Increase production reliability
- Optimize maintenance planning
Predictive Maintenance Through Data Analytics
Traditional maintenance schedules often rely on fixed intervals, regardless of equipment condition. Modern Business Intelligence for Manufacturing enables predictive maintenance by analyzing historical machine data, maintenance records, and sensor information to identify early warning signs of equipment failure.
Rather than replacing components too early—or too late—maintenance teams can service equipment when performance indicators suggest intervention is needed.
Benefits:
- Reduce unplanned downtime
- Extend equipment lifespan
- Lower maintenance costs
- Improve maintenance scheduling
- Increase overall equipment reliability
Monitoring Overall Equipment Effectiveness (OEE)
Overall Equipment Effectiveness (OEE) is one of the most important manufacturing KPIs because it measures how effectively production equipment is being utilized. A Manufacturing KPI Dashboard continuously tracks Availability, Performance, and Quality to provide a complete picture of equipment efficiency.
Instead of manually calculating OEE, manufacturers can monitor real-time performance across multiple production lines and quickly identify areas requiring improvement.
Benefits:
- Measure production efficiency
- Improve equipment performance
- Identify hidden production losses
- Benchmark manufacturing performance
- Support continuous improvement initiatives
Root Cause Analysis
Reducing downtime requires understanding why production issues occur—not simply recording that they happened. BI dashboards collect operational data from multiple systems, allowing manufacturers to identify recurring failure patterns, production bottlenecks, and process inefficiencies.
Interactive dashboards enable teams to drill down into production data, compare historical trends, and uncover the root causes behind downtime events.
Benefits:
- Identify recurring production issues
- Reduce repetitive failures
- Improve troubleshooting speed
- Support data-driven decision-making
- Increase operational stability
Production KPI Monitoring
Manufacturers rely on key performance indicators (KPIs) to measure operational efficiency and production health. Manufacturing Analytics Dashboards automatically monitor critical KPIs, helping managers quickly recognize performance deviations before they impact production targets.
Continuous KPI monitoring enables organizations to improve productivity while maintaining quality standards across production operations.
Benefits:
- Monitor production efficiency
- Improve operational performance
- Track manufacturing targets
- Reduce production variability
- Increase decision-making accuracy
Inventory and Material Visibility
Production frequently stops because the required raw materials or components are unavailable at the right time. BI dashboards integrate inventory management systems with production planning, allowing manufacturers to monitor stock levels, supplier performance, and material consumption in real time.
Improved inventory visibility reduces material shortages while helping organizations optimize procurement and warehouse operations.
Benefits:
- Prevent material shortages
- Improve inventory planning
- Reduce production interruptions
- Enhance supply chain visibility
- Optimize warehouse operations
Quality Monitoring and Defect Analysis
Quality issues can significantly increase manufacturing downtime by requiring production rework, inspections, or product recalls. A Manufacturing Dashboard Software solution continuously tracks quality metrics such as defect rates, scrap percentages, inspection results, and production yield.
By identifying quality trends early, manufacturers can implement corrective actions before defects affect large production batches.
Benefits:
- Reduce product defects
- Lower scrap rates
- Improve product quality
- Minimize rework
- Increase customer satisfaction
Essential KPIs Every Manufacturing BI Dashboard Should Track
An effective BI Dashboard for Manufacturing is only as valuable as the metrics it monitors. Tracking the right Key Performance Indicators (KPIs) helps manufacturers measure operational performance, identify production inefficiencies, and make informed business decisions.
The following KPIs are among the most important for improving factory performance and minimizing downtime.
| Manufacturing KPI | Why It Matters | Business Impact |
| Overall Equipment Effectiveness (OEE) | Measures equipment availability, performance, and quality. | Maximizes production efficiency and identifies hidden losses. |
| Machine Utilization | Tracks how effectively equipment is being used during production. | Improves asset utilization and production capacity planning. |
| Machine Downtime | Measures planned and unplanned equipment stoppages. | Reduces operational disruptions and maintenance costs. |
| Mean Time Between Failures (MTBF) | Indicates equipment reliability by measuring time between failures. | Supports predictive maintenance and improves equipment lifespan. |
| Mean Time to Repair (MTTR) | Measures the average time required to restore equipment after failure. | Accelerates maintenance response and reduces downtime duration. |
| Production Throughput | Tracks the number of units produced within a specific time period. | Increases manufacturing productivity and output consistency. |
| Production Cycle Time | Measures the time required to complete one production cycle. | Identifies bottlenecks and improves operational efficiency. |
| Scrap Rate | Tracks the percentage of materials wasted during production. | Reduces material costs and improves manufacturing quality. |
| Defect Rate | Measures the number of defective products produced. | Improves product quality and reduces customer complaints. |
| Production Yield | Calculates the percentage of products meeting quality standards. | Increases profitability through higher-quality output. |
Features of an Effective Manufacturing BI Dashboard
Not all dashboards provide the same level of operational insight. A modern Manufacturing BI Dashboard should go beyond static reporting and enable real-time monitoring, predictive analysis, and interactive decision-making across the factory floor.
Key features include:
- Real-time production monitoring
- Interactive dashboards with drill-down analytics
- Automated KPI reporting
- Customizable executive and operational dashboards
- Predictive analytics for equipment maintenance
- Real-time alerts and notifications
- ERP, MES, SCADA, and IoT integration
- Mobile-friendly dashboard access
- Historical trend analysis
- Role-based reporting and security
- AI-powered forecasting and recommendations
- Cloud-based dashboard accessibility
Benefits of BI Dashboards in Manufacturing
Implementing BI Dashboards for Manufacturing delivers measurable improvements across production, maintenance, quality, and operational performance. Organizations that leverage Business Intelligence gain better visibility into manufacturing processes, allowing them to reduce downtime while increasing productivity and profitability.
Key business benefits include:
- Reduce equipment downtime
- Improve Overall Equipment Effectiveness (OEE)
- Increase production efficiency
- Enhance operational visibility
- Enable faster, data-driven decisions
- Improve predictive maintenance planning
- Reduce manufacturing costs
- Increase product quality
- Optimize inventory management
- Improve resource utilization
- Enhance production forecasting
- Support continuous improvement initiatives
Real-World Use Cases of BI Dashboards in Manufacturing
Every manufacturing organization has unique operational challenges, but one common goal remains the same—reducing downtime while maximizing production efficiency. BI Dashboards for Manufacturing help businesses monitor operations in real time, identify bottlenecks, and make proactive decisions using data instead of assumptions.
Below are some practical examples of how different manufacturing sectors use Business Intelligence dashboards to improve operational performance.
Automotive Manufacturing
Automotive manufacturers operate highly automated production lines where even a few minutes of downtime can delay production schedules and increase operational costs. Manufacturing BI Dashboards provide real-time visibility into assembly lines, robotic systems, equipment performance, and production throughput.
Manufacturing leaders can monitor OEE, machine utilization, production cycle times, and quality metrics to quickly identify bottlenecks before they impact output.
Common Applications:
- Production line monitoring
- Robotic equipment performance
- OEE tracking
- Predictive maintenance
- Supply chain visibility
Electronics Manufacturing
Electronics production requires precision, quality control, and efficient inventory management. BI dashboards help manufacturers monitor component availability, defect rates, production efficiency, and testing performance while reducing quality-related downtime.
Interactive dashboards also provide engineering teams with historical production insights that support continuous process improvements.
Common Applications:
- Component inventory tracking
- PCB production monitoring
- Defect analysis
- Quality inspection reporting
- Production forecasting
Food & Beverage Manufacturing
Food manufacturers must maintain strict production schedules while ensuring compliance with food safety regulations. Manufacturing Dashboard Software helps monitor production efficiency, batch quality, inventory levels, equipment utilization, and cold storage operations.
Real-time alerts help operators respond immediately to temperature deviations, equipment failures, or production delays.
Common Applications:
- Production monitoring
- Cold chain visibility
- Inventory management
- Equipment maintenance
- Quality compliance reporting
Pharmaceutical Manufacturing
Pharmaceutical companies rely on accurate production data, regulatory compliance, and strict quality assurance processes. BI dashboards integrate manufacturing, laboratory, and quality systems to provide complete visibility across production operations.
This enables manufacturers to identify process deviations early while maintaining compliance with industry regulations.
Common Applications:
- Batch production monitoring
- Regulatory compliance reporting
- Quality assurance dashboards
- Equipment validation
- Production traceability
Heavy Engineering & Industrial Manufacturing
Heavy manufacturing facilities operate expensive machinery where equipment failures can significantly impact productivity. BI dashboards help maintenance teams monitor asset health, production schedules, and maintenance performance to improve operational reliability.
Historical analytics also support long-term asset management strategies.
Common Applications:
- Asset monitoring
- Predictive maintenance
- Equipment utilization
- Maintenance analytics
- Production performance tracking
Chemical Manufacturing
Chemical plants require continuous monitoring of production parameters, equipment performance, and safety metrics. BI dashboards consolidate operational data to help manufacturers optimize production efficiency while minimizing process disruptions.
Interactive dashboards also support regulatory reporting and operational risk management.
Common Applications:
- Process monitoring
- Production efficiency analysis
- Equipment reliability
- Safety reporting
- Energy consumption monitoring
Textile Manufacturing
Textile manufacturers manage multiple production stages, including spinning, weaving, dyeing, and finishing. BI dashboards provide real-time visibility into production performance, machine efficiency, material utilization, and product quality.
Operations teams can quickly identify inefficiencies and optimize production workflows across manufacturing facilities.
Common Applications:
- Production tracking
- Machine performance monitoring
- Inventory optimization
- Quality management
- Production planning
Best Practices for Implementing BI Dashboards in Manufacturing
Implementing Business Intelligence for Manufacturing requires more than selecting a dashboard platform. Success depends on integrating reliable data sources, defining meaningful KPIs, and ensuring dashboards support real business decisions. Following proven implementation practices helps manufacturers maximize the value of their BI investments.
Define Clear Business Objectives
Before designing dashboards, identify the business problems you want to solve. Whether the goal is reducing downtime, improving production efficiency, or optimizing maintenance schedules, clearly defined objectives ensure dashboards focus on actionable insights rather than excessive data.
Monitor the Right Manufacturing KPIs
Tracking too many metrics often creates information overload. Focus on KPIs that directly influence operational performance, such as OEE, machine utilization, MTBF, MTTR, production throughput, defect rates, and inventory availability.
Integrate Data from Multiple Systems
The most effective Manufacturing BI Dashboards combine information from ERP, MES, SCADA, CMMS, Warehouse Management Systems, and Industrial IoT devices. A unified data environment eliminates silos and provides a complete view of manufacturing operations.
Ensure High-Quality Data
Reliable dashboards depend on reliable data. Establish strong data governance practices to maintain accurate, complete, and consistent manufacturing information across all connected systems.
Enable Real-Time Monitoring
Real-time dashboards allow production teams to identify issues immediately instead of relying on delayed reports. Live operational visibility supports faster decision-making and significantly reduces response times during production incidents.
Design Role-Based Dashboards
Different users require different insights. Plant managers, maintenance engineers, production supervisors, and executives should each have dashboards tailored to their specific responsibilities and KPIs.
Use Predictive Analytics
Modern BI platforms increasingly incorporate AI and machine learning to forecast equipment failures, identify production trends, and recommend proactive maintenance activities before downtime occurs.
Continuously Improve Dashboard Performance
Manufacturing operations evolve over time. Regularly review dashboard usage, update KPIs, integrate new data sources, and refine visualizations to ensure dashboards continue supporting business goals.
The Future of BI Dashboards in Manufacturing
Manufacturing is entering a new era driven by Industry 4.0, Industrial IoT, Artificial Intelligence, and advanced analytics. As factories become increasingly connected, BI Dashboards for Manufacturing are evolving from reporting tools into intelligent decision-support systems that provide predictive insights and automated recommendations.
Future manufacturing dashboards will combine real-time operational data with AI-powered analytics to help organizations predict equipment failures, optimize production schedules, reduce energy consumption, and improve overall operational efficiency.
Emerging innovations shaping the future of manufacturing Business Intelligence include:
- AI-powered predictive analytics
- Industrial IoT (IIoT) integration
- Digital Twin technology
- Edge computing for real-time analytics
- Embedded analytics within manufacturing applications
- Self-service Business Intelligence
- Natural language querying for dashboards
- Automated anomaly detection
- Generative AI-assisted reporting
- Cloud-native manufacturing analytics platforms
Organizations that invest in intelligent Manufacturing Analytics Dashboards today will be better positioned to improve agility, increase productivity, and remain competitive in an increasingly data-driven manufacturing landscape.
Why Choose Panth Softech for Manufacturing BI Solutions?
Turning manufacturing data into actionable business intelligence requires expertise in data engineering, analytics, cloud technologies, and enterprise system integration. At Panth Softech, we help manufacturers design and implement scalable BI Dashards for Manufacturing that provide real-time operational visibility and support smarter business decisions.
Our team works closely with manufacturers to integrate data from ERP, MES, SCADA, IoT devices, and production systems into centralized dashboards that deliver meaningful insights across the entire manufacturing lifecycle. From KPI reporting and predictive analytics to executive dashboards and production monitoring, we build solutions tailored to your operational goals.
Our Manufacturing BI capabilities include:
- Custom BI Dashboard Development
- Manufacturing KPI & OEE Dashboards
- ERP, MES, SCADA & IoT Integration
- Data Engineering & Data Warehousing
- Cloud-Based Analytics Platforms
- AI-Powered Predictive Analytics
- Executive & Operational Dashboards
- Real-Time Manufacturing Reporting
- Data Visualization & Self-Service BI
- Ongoing Dashboard Optimization & Support
Whether you’re looking to reduce downtime, improve production efficiency, or accelerate your Industry 4.0 initiatives, Panth Softech delivers end-to-end Data Analytics & Business Intelligence Services that transform manufacturing data into measurable business outcomes.
Ready to Reduce Downtime with Smarter Manufacturing Dashboards?
Empower your operations team with real-time visibility, actionable insights, and intelligent reporting that drive measurable improvements in productivity, efficiency, and profitability.
Schedule a consultation to discover how our Data Analytics & Business Intelligence Services can help you build custom BI Dashboards for Manufacturing that transform production data into a competitive advantage.
Frequently Asked Questions (FAQs)
What are BI Dashboards for Manufacturing?
BI Dashboards for Manufacturing are interactive reporting tools that consolidate production, maintenance, inventory, and operational data into a centralized dashboard. They help manufacturers monitor KPIs in real time, identify production issues, and improve decision-making.
How do BI dashboards help reduce manufacturing downtime?
BI dashboards provide real-time visibility into machine performance, production efficiency, and maintenance activities. By identifying anomalies and performance trends early, manufacturers can take proactive action to prevent unexpected equipment failures and minimize downtime.
Which KPIs should a Manufacturing BI Dashboard track?
The most important manufacturing KPIs include Overall Equipment Effectiveness (OEE), Machine Utilization, Machine Downtime, Mean Time Between Failures (MTBF), Mean Time to Repair (MTTR), Production Throughput, Production Cycle Time, Scrap Rate, Defect Rate, and Production Yield.
Can BI dashboards integrate with ERP and MES systems?
Yes. Modern BI dashboard platforms can integrate with ERP, Manufacturing Execution Systems (MES), SCADA, CMMS, Warehouse Management Systems (WMS), Industrial IoT devices, and cloud databases to provide a unified view of manufacturing operations.
What are the benefits of Manufacturing BI Dashboards?
Manufacturing BI dashboards improve operational visibility, reduce equipment downtime, increase production efficiency, support predictive maintenance, optimize inventory management, enhance quality control, and enable faster data-driven decision-making.
How does AI improve Manufacturing BI Dashboards?
AI enhances BI dashboards by enabling predictive maintenance, anomaly detection, demand forecasting, intelligent alerts, production optimization, and automated insights that help manufacturers make proactive operational decisions.
Which industries benefit from Manufacturing BI Solutions?
Industries including automotive, electronics, food & beverage, pharmaceuticals, heavy engineering, chemicals, textiles, consumer goods, and industrial manufacturing can leverage BI dashboards to improve operational efficiency and reduce production downtime.