Panth Softech Team
Introduction: Why Most Businesses Are Still Making Decisions Too Late
You’re running campaigns, tracking sales, managing operations—but your data is scattered across spreadsheets, CRMs, and tools. By the time you generate reports, the opportunity is already gone.
This is the exact problem a Business Intelligence Dashboard solves.
Instead of reacting late, you start making decisions in real time.
A well-built dashboard turns raw data into live insights, helping B2B owners, startups, and SMEs move faster, reduce risks, and scale smarter.
If you want to stop guessing and start making data-backed decisions instantly, this guide is for you.
Quick Summary
- A Business Intelligence Dashboard converts raw data into real-time insights
- Tools like Power BI and Tableau dominate the market
- Strong architecture is key (data → processing → visualization)
- Start with clear goals and scale gradually
- Avoid clutter and focus on actionable metrics
What is a Business Intelligence Dashboard?
A Business Intelligence Dashboard is a visual interface that displays real-time data from multiple sources, allowing businesses to monitor performance, identify trends, and make faster decisions.
It typically includes:
- KPIs (Key Performance Indicators)
- Charts & graphs
- Real-time metrics
- Drill-down reports
In simple terms:
It turns complex data into easy-to-understand insights.
Why Real-Time BI Dashboards Matter in 2026
The shift from static reports to real-time analytics is no longer optional.
Key Benefits:
- Faster decision-making
- Improved operational efficiency
- Early problem detection
- Better forecasting accuracy
- Enhanced customer experience
Example:
A SaaS company tracking user churn in real time can reduce losses instantly, instead of discovering issues weeks later.
Types of Business Intelligence Dashboards
Understanding the types helps you choose the right strategy.
1. Operational Dashboards
Track daily operations like sales, inventory, or customer activity.
2. Strategic Dashboards
Used by leadership for long-term decision-making.
3. Analytical Dashboards
Focus on deep data analysis and trends.
4. Tactical Dashboards
Used by managers for performance tracking.
Best Tools for Business Intelligence Dashboards
Choosing the right tools defines your success.
Popular Business Intelligence Tools Comparison
| Tool | Best For | Key Features | Pricing |
| Power BI | SMEs & Enterprises | Real-time dashboards, AI insights | Affordable |
| Tableau | Data Visualization | Advanced visuals | Premium |
| Google Data Studio | Beginners | Free & easy to use | Free |
| Looker | Data-driven orgs | Strong modeling layer | Expensive |
| Qlik Sense | Enterprise analytics | Associative engine | Mid-high |
Why Power BI is a Top Choice
- Easy integration with Microsoft ecosystem
- Strong visualization capabilities
- Real-time data streaming
- Scalable for SMEs
Many businesses start with power bi dashboards due to affordability and flexibility.
Power BI Dashboards Examples (Real Use Cases)
1. Sales Dashboard
Tracks revenue, conversion rate, and sales pipeline.
2. Marketing Dashboard
Monitors campaign performance, ROI, and leads.
3. Financial Dashboard
Displays cash flow, expenses, and profit margins.
4. Operations Dashboard
Tracks supply chain and efficiency metrics.
These power bi dashboards examples show how businesses convert data into actionable insights.
Architecture of a Real-Time Business Intelligence Dashboard
This is where most blogs stay shallow—but this is the real game.
Core Architecture Layers:
1. Data Sources
- CRM (Salesforce, HubSpot)
- ERP systems
- APIs
- Databases
2. Data Ingestion Layer
- ETL/ELT pipelines
- Streaming tools (Kafka, Azure Stream Analytics)
3. Data Storage Layer
- Data warehouse (Snowflake, BigQuery)
- Data lakes
4. Data Processing Layer
- Data transformation
- Cleaning & enrichment
5. Visualization Layer
- BI tools (Power BI, Tableau)
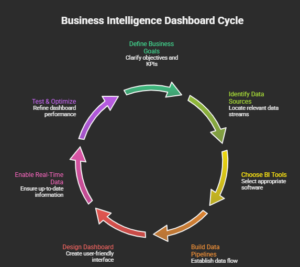
Simplified Flow:
Step-by-Step: How to Build a Real-Time BI Dashboard
Step 1: Define Business Goals
Ask:
- What decisions will this dashboard support?
- Which KPIs matter most?
Without this, your dashboard becomes noisy.
Step 2: Identify Data Sources
List all systems:
- CRM
- Marketing tools
- Finance software
Ensure data consistency.
Step 3: Choose the Right Tools for Business Intelligence
Pick based on:
- Budget
- Team expertise
- Scalability
This is where selecting the right tools for business intelligence becomes critical.
Step 4: Build Data Pipelines
Use:
- ETL tools (Fivetran, Talend)
- Streaming tools for real-time data
Step 5: Design the Dashboard
Focus on:
- Clarity over complexity
- Minimalist design
- Actionable insights
Step 6: Enable Real-Time Data
Use:
- APIs
- Streaming datasets
- DirectQuery (Power BI)
Step 7: Test & Optimize
- Validate data accuracy
- Improve loading speed
- Gather user feedback
Best Practices for High-Performance BI Dashboards
1. Focus on Key Metrics Only
Too much data = confusion.
2. Use Clear Visual Hierarchy
Guide user attention.
3. Optimize for Speed
Slow dashboards kill adoption.
4. Ensure Data Accuracy
Garbage in = garbage out.
5. Enable Drill-Down Features
Let users explore deeper.
Common Mistakes to Avoid
❌ Overloading the Dashboard
Too many charts = no clarity.
❌ Ignoring End Users
Design for users, not developers.
❌ Poor Data Integration
Disconnected data leads to wrong insights.
❌ No Real-Time Capability
Delayed insights = missed opportunities.
Pros and Cons of Real-Time BI Dashboards
| Pros | Cons |
| Instant insights | Higher infrastructure cost |
| Faster decisions | Complex setup |
| Competitive advantage | Requires maintenance |
| Better forecasting | Data quality dependency |
How Panth Softech Helps You Build BI Dashboards
At Panth Softech, we help businesses:
- Design custom Business Intelligence Dashboards
- Integrate real-time data pipelines
- Build scalable BI architecture
- Implement power bi dashboards tailored to your needs
Whether you’re a startup or an enterprise, we turn your data into a growth engine.
Talk to an expert. Explore our services.
FAQs About Building Real-Time Business Intelligence Dashboards
1. How can businesses prioritize which KPIs to include in a real-time business intelligence dashboard?
Start by identifying the metrics that directly impact business goals, such as revenue, customer acquisition, operational efficiency, inventory, or service performance. A focused dashboard with meaningful KPIs helps decision-makers respond faster while avoiding unnecessary data that can slow analysis and reduce productivity.
2. What architecture is best for building a scalable real-time BI dashboard?
A scalable BI architecture typically includes multiple data sources, ETL or ELT pipelines, a centralized data warehouse or lake, real-time data processing, analytics tools, and visualization dashboards. This structure supports faster reporting, easier integration, and future business growth without frequent system redesigns.
3. How can businesses ensure data accuracy in real-time dashboards?
Data accuracy depends on automated validation, standardized data formats, regular quality checks, and reliable integrations with source systems. Establishing strong data governance practices helps businesses eliminate duplicate records, reduce reporting errors, and build confidence in real-time business insights.
4. What common mistakes should companies avoid when implementing a business intelligence dashboard?
Common mistakes include tracking too many KPIs, ignoring data quality, designing complex dashboards, failing to involve business users, and overlooking scalability. Planning around business objectives and user needs results in dashboards that are easier to adopt and deliver greater long-term value.
5. How does Panth Softech design business intelligence dashboards that support business growth?
Panth Softech works closely with clients to understand reporting requirements, operational workflows, and decision-making processes. The team builds customized BI dashboards with intuitive visualizations, real-time reporting, secure integrations, and scalable architecture to help businesses improve performance and make informed strategic decisions.
6. How can real-time business intelligence dashboards support executive decision-making?
Executives gain instant visibility into business performance through live dashboards that highlight KPIs, trends, risks, and opportunities. This enables faster responses to operational issues, more accurate forecasting, and data-driven strategic planning without waiting for manual reports or periodic updates.
7. Why should organizations choose Panth Softech for Business Intelligence and dashboard development?
Panth Softech combines expertise in business intelligence, data integration, cloud technologies, and custom software development to deliver secure and scalable dashboard solutions. The company focuses on usability, performance, and long-term support, enabling organizations to transform complex data into actionable business intelligence.