Panth Softech Team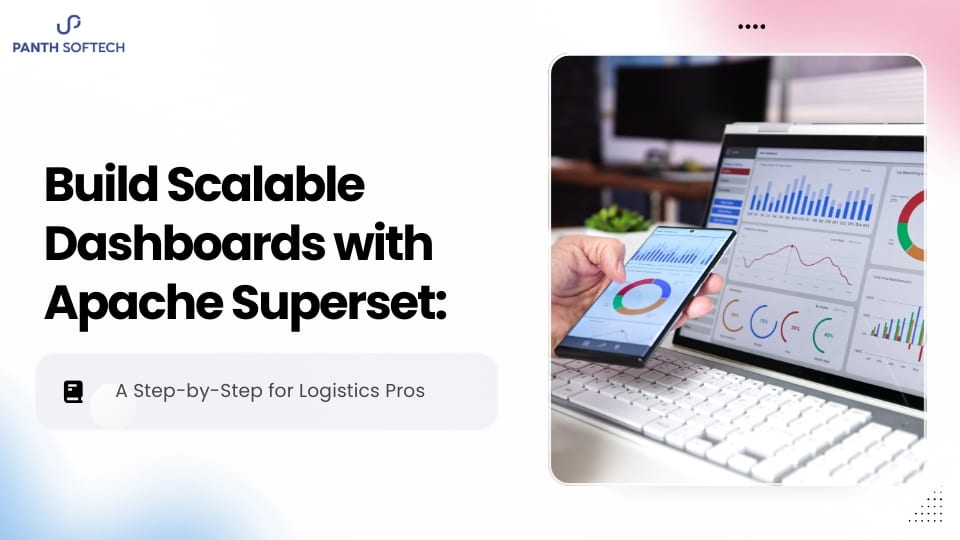
The logistics industry runs on speed, accuracy, and real-time decision-making. As companies deal with rising fuel prices, delivery delays, and increasing customer expectations, teams need stronger visibility across operations. This is where a powerful Logistics management service supported by modern dashboards becomes essential.
Today, open-source tools like Apache Superset are helping businesses build scalable, affordable, and efficient analytics systems. With the right setup, Apache Superset dashboards can help logistics professionals. They provide insights to optimize routes, cut costs, and improve delivery performance.
At Panth Softech, we help logistics companies adopt reliable Logistics business intelligence systems that transform data into actionable insights. This guide provides a clear, step-by-step way to create scalable dashboards with Apache Superset. You can follow it easily, even if you are new to BI tools.
Why Logistics Teams Need Modern Intelligence and Dashboards
The logistics sector faces many challenges. These include unpredictable delivery times, scattered data, unoptimized routes, and no real-time performance tracking. Traditional spreadsheets or outdated tools fall short because they cannot handle live data or advanced analytics requirements.
That’s why companies are using data visualization platforms and business intelligence tools. These tools help provide deeper and more interactive insights.
Modern dashboards help logistics companies:
- Monitor routes and delivery times
- Track vehicle performance
- Analyze warehouse operations
- Measure carrier performance
- Identify bottlenecks in the supply chain
- Reduce fuel and maintenance costs
Apache Superset stands out because it is open-source, scalable, and easy to customize. It is one of the best dashboard tools for logistics. It is great for companies that want enterprise-level BI without high licensing costs.
Understanding Apache Superset for Logistics Professionals
Apache Superset is an open-source BI platform designed to help organizations explore data and build fast, interactive dashboards. It supports multiple data sources, including SQL databases, cloud warehouses, and real-time APIs.
For logistics companies, Superset enables the creation of supply chain performance dashboards that monitor:
- Delivery speed
- Average transit time
- Warehouse loading and unloading
- Vehicle utilization
- Region-wise order volume
- Shipment delays
- On-time delivery performance
This makes it an ideal fit for growing logistics businesses that need scalable and cost-effective analytics solutions.
Step-by-Step Guide: Build Scalable Apache Superset Dashboards for Logistics
Below is a straightforward process that any logistics professional can follow to build dashboards with Apache Superset.
Step 1: Prepare Your Data Sources
Your dashboards are only as strong as your data. Logistics companies typically use:
- Fleet management systems
- Route optimization software
- Warehouse management systems
- ERP and CRM tools
- GPS and IoT trackers
- Delivery apps
Apache Superset connects to all major databases like PostgreSQL, MySQL, Snowflake, BigQuery, and more. Before building dashboards:
- Clean your data
- Combine relevant fields (route, delivery time, distance, vehicle ID, location, etc.)
- Ensure consistent formatting
- Remove duplicates and wrong values
Clean data ensures accurate logistics performance monitoring tools.
Step 2: Connect Apache Superset to Your Database
Once your data is ready, log in to Superset and follow these steps:
- Go to Settings
- Add Database
- Enter SQL connection details
- Test the connection
- Save
Superset will now read your logistics data and make it available for visualization.
Step 3: Explore Your Data for Initial Insights
Before building dashboards, use Superset’s Explore tool to analyze your tables. This helps you understand:
- Average delivery times
- Delivery failures
- Vehicle performance trends
- Peak shipment hours
- Driver performance metrics
- Regional delays
This step is important because it lays the foundation for effective Logistics business intelligence.
Step 4: Create Your First Logistic Visualizations
Apache Superset offers multiple chart types useful for logistics operations. Some essential visuals include:
1. Line Chart: Delivery Time Trends
Shows day-wise or week-wise movement. Helps identify delays and seasonal patterns.
2. KPI Cards: Total Deliveries, On-Time Rate, Delay Counts
These act as high-level metrics for leadership teams.
3. Bar Chart: Region-Wise Delivery Performance
Useful for analyzing which zones are facing delays.
4. Geo Map: Vehicle or Delivery Location Tracking
A must-have visualization for supply chain and fleet management.
5. Pie Chart: Shipment Type Distribution
Shows product category share across shipments.
6. Table Chart: Driver-Wise or Vehicle-Wise Performance
Useful for team evaluation and task allocation.
These visualizations help create strong Logistics performance monitoring tools.
Step 5: Assemble Your Logistics Dashboard
Now that your charts are ready, it’s time to build your first complete dashboard.
- Go to Dashboard
- Click Create New Dashboard
- Add title: Logistics Performance Dashboard
- Drag and drop charts into the layout
- Adjust width and height for clarity
- Add filters like:
- Date
- Region
- Vehicle type
- Route
- Driver
Filters make dashboards interactive and actionable.
This is how Apache Superset dashboards become user-friendly for operations teams.
Step 6: Set Up Refresh Schedules for Real-Time Logistics Insights
Logistics decisions depend on live data. Superset allows you to schedule data refreshes or connect to streaming pipelines.
Benefits of auto-refresh:
- Real-time delivery monitoring
- Updated driver performance
- Accurate route optimization
- Better warehouse planning
This helps companies strengthen their Logistics management service with predictive and proactive decision-making.
Step 7: Share Dashboards with Teams and Leadership
Superset allows easy sharing of reports and dashboards. You can assign permissions based on team roles:
- Operations managers
- Fleet supervisors
- Warehouse teams
- Leadership
- Client servicing teams
Sharing improves transparency and accountability across the logistics chain.
Step 8: Scale Your Dashboards as Your Logistics Business Grows
One of the biggest advantages of Superset is scalability. As your logistics network expands:
- Add new routes
- Add new vehicles
- Integrate IoT sensors
- Track new regions
- Build more dashboards
Superset supports large datasets and complex visualizations, making it perfect for long-term growth.
As one of the leading providers of modern BI, Panth Softech helps logistics companies build scalable, future-ready dashboards that expand as business demands grow.
Best Practices for Building High-Impact Logistics Dashboards
To get the most from your dashboards:
- Keep charts simple and clear
- Use color coding for delays or performance issues
- Highlight important KPIs at the top
- Make navigation easy
- Use maps for geographic performance
- Test dashboards with real users
- Add only necessary filters
These best practices help create clean and effective supply chain performance dashboards.
Why Apache Superset Is the Best Choice for Logistics Teams
Apache Superset is becoming one of the best dashboard tools for logistics because it offers:
- No licensing cost
- Fast performance
- Support for large datasets
- Customizable dashboards
- Wide integration options
- Easy SQL-based exploration
- Enterprise-level security
For logistics companies looking to scale and modernize operations, Superset is a powerful choice.
Conclusion: Build Smarter, Faster, and Scalable Dashboards with Panth Softech
Building analytics tools does not have to be expensive or complicated. With Apache Superset, logistics companies can create great dashboards. These dashboards improve visibility, reduce delays, and help make better decisions. A strong Logistics management service powered by analytics helps companies strengthen operations, reduce cost leaks, and improve customer satisfaction.
Panth Softech helps logistics teams use Apache Superset dashboards. They integrate databases, customize KPIs, and create complete logistics business intelligence systems. This supports long-term growth. If your logistics company wants real-time insights and scalable analytics tools, our team is ready to support you.
FAQ About Building Real-Time Logistics Dashboards with Apache Superset
1. What is Apache Superset used for?
Apache Superset is an open-source business intelligence (BI) tool used to create interactive dashboards and reports. Businesses use it to visualize data, monitor KPIs, analyze trends, and make data-driven decisions. In logistics, it helps track shipments, warehouse performance, fleet operations, and supply chain metrics in real time.
2. Can Apache Superset display real-time data?
Yes, Apache Superset can display near real-time data by connecting directly to databases, cloud data warehouses, and streaming data sources. Dashboard refresh intervals can be configured to show the latest operational data, making it suitable for monitoring live logistics and supply chain performance.
3. How do you create a logistics dashboard in Apache Superset?
To build a logistics dashboard, connect Apache Superset to your logistics database, create datasets, design charts for key metrics such as deliveries, inventory, and fleet tracking, and combine them into a single dashboard. You can also add filters and role-based access for different business teams.
4. What KPIs should be included in a logistics dashboard?
A logistics dashboard should track shipment status, on-time delivery rate, order fulfillment, inventory levels, warehouse utilization, transportation costs, fleet utilization, delivery delays, fuel consumption, and average delivery time. These KPIs help businesses improve operational efficiency and customer satisfaction.
5. Is Apache Superset better than Power BI or Tableau for logistics dashboards?
Apache Superset is a great choice for organizations looking for an open-source, highly customizable BI platform without expensive licensing costs. Power BI and Tableau offer more built-in enterprise features, while Superset provides greater flexibility for businesses with in-house development teams and custom data requirements.
6. Can Apache Superset integrate with ERP, WMS, and TMS systems?
Yes. Apache Superset can connect to databases that power ERP, Warehouse Management Systems (WMS), Transportation Management Systems (TMS), and other logistics platforms. This enables businesses to combine data from multiple systems into a single dashboard for complete supply chain visibility.
7. Why should I choose Panth Softech for Apache Superset dashboard development?
Panth Softech specializes in developing custom Apache Superset solutions for logistics, manufacturing, retail, and enterprise businesses. The team handles data integration, dashboard development, KPI visualization, security, and ongoing support to help organizations build scalable, real-time analytics platforms tailored to their operational needs.